
Having difficulty sorting through external technology in a way that easily translates into a business strategy? Scouting teams are faced with the difficult challenge of scouring through an ever-increasing pool of external innovations and identifying which ones have the potential to create a strategic advantage for the company. The greater challenge is to present this information to the business side in a way that is easy to understand and clearly identifies the stages, potential, and overall fit of the opportunity. A great way to present this data is through the use of a Technology Landscape Map (TLM), TLM’s allow tech scouts to easily convey technology trends and enable a visualization of key internal initiatives, related scouting projects, and potential opportunities in the process. Below the map created by Spitsberg and Verti shows how to create a basic TLM and implement it within your workflow.
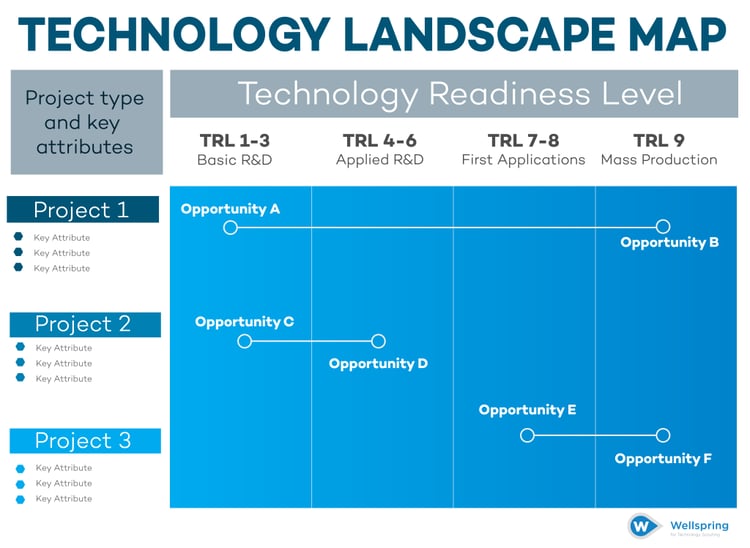
Step 1 - Determine scouting projects for key internal initiatives
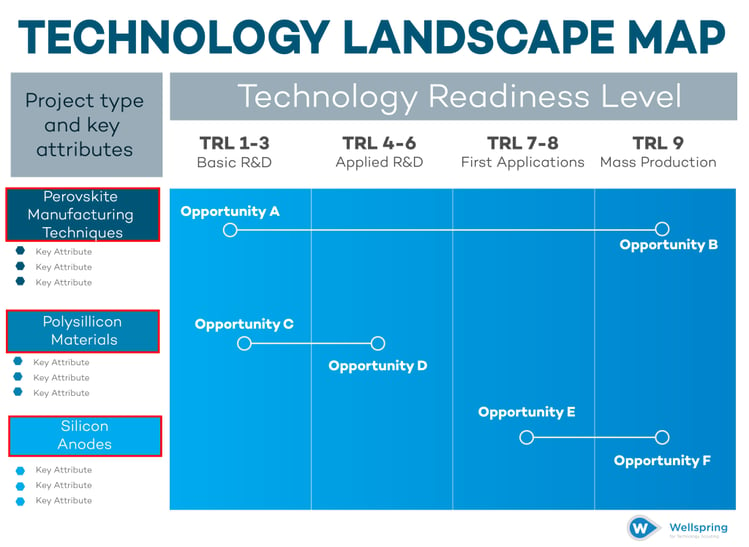
Most organizations plan for future product features on a 1-5-10 year timeline and create strategic R&D initiatives based on these plans. In order to effectively map the technology landscape, scouting teams should first break down these internal initiatives into groups of related projects. These projects can be classified by business unit, project type, timeline, or any other broad categorization that makes sense for the business. This aids in better organization of products and helps technology scouts stay focused on technologies that have been determined to be strategically important to the organization; the more specific the project categories, the more effectively key projects can be identified.
For example, a solar panel manufacturer may have several key initiatives including perovskite manufacturing techniques, new polysilicon materials, and silicon anodes for batteries.
Step 2 – List the technology attributes for each technology
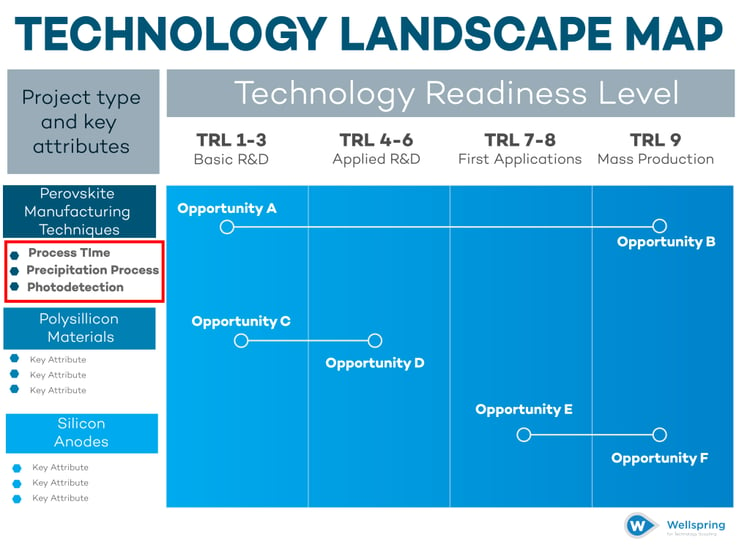
After the broad project groupings are created, the technology scouting team should begin listing the key attributes that they will look for when assessing external opportunities. These attributes should begin with the most important aspect of a potential technology for this project and gradually decreases in importance. This allows individuals reading the graph to quickly identify the critical aspects of the technology.
Continuing our example from Step 1, the perovskite manufacturing techniques project would list key attributes of improved processing time, improved precipitation process, and improved photodetection.
Step 3 – Identify external opportunities and plot based on their TRL
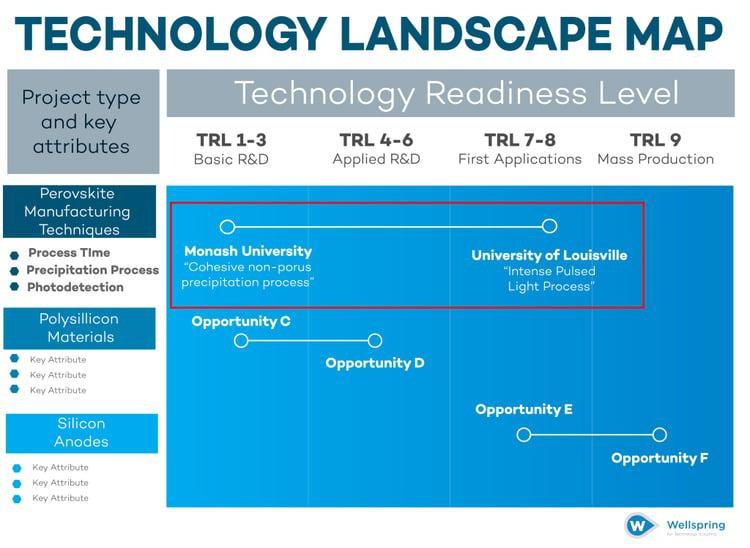
As scouts meet partners, attend conferences, and search online databases, they should plot the newly discovered technology opportunities onto the project band of their technology landscape map based on the relative technology readiness level. This ranking methodology helps identify which projects have the highest ‘readiness’ in terms of commercialization and clearly outlines which opportunities may have a more immediate return.
To further this example, the scout is able to gather information on two promising technologies. The first technology is from Monash University and matches the precipitation process improvement criteria, and is a TRL 1-3. The other is from the University of Louisville, and matches the process effectiveness criteria and is a TRL 7-8. These are only examples to illustrate how to plot a technology on the map.
Step 4 – Repeat for each technology project
The relative position of each technology opportunity based on the TRL indicates the maturity and competitive position of the technologies. The overall map provides a simple visual that can be shared with business unit leaders to help prioritize opportunities that best match the competitive landscape with overall internal needs of the organization.
The length of the line between technologies helps indicate the maturity of the technology field and could be used to help teams identify highly advanced, or early stage developments, allowing teams to prioritize technology investments based on the common 1-5-10 year timeline.
Moving Forward
The Technology Landscape Map is a valuable tool for visualizing the relative position and maturity of key external technologies and how those technologies relate to internal product initiatives. By developing TLM graphics, technology scouting teams can easily communicate the state of the technology market and help business units better prioritize the types of research they should invest in.
Given the complex nature of technological innovation, technology mapping allows for a simple way to visualize various technologies and the stages of their development. This helps simplify the decision-making process by better identifying key technologies. By understanding these technological drivers, firms are able to better predict the technology's impact and improve new business creation.
Sources: “Technology Landscape Mapping – The Heart of Open Innovation” Spitsberg, Brahmandam, Verti, Coulston.